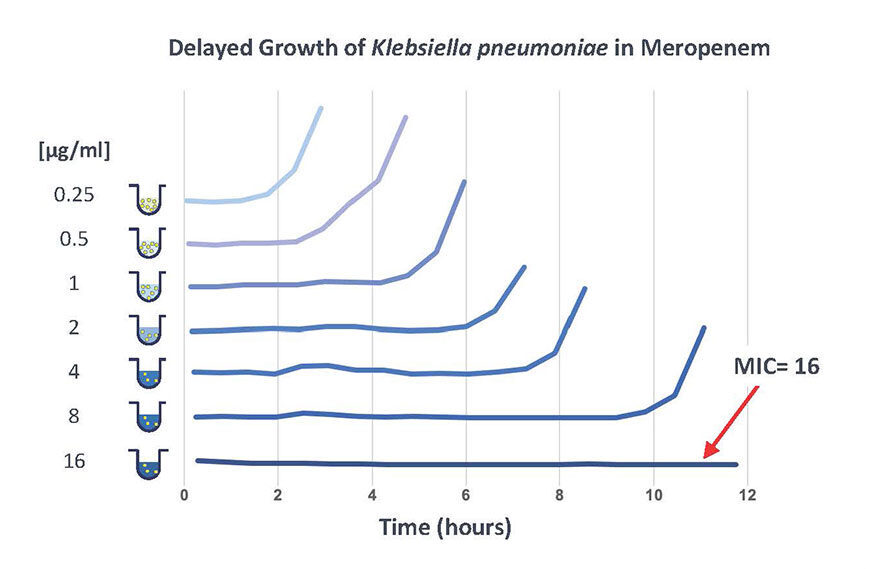
Concentration v.s. Time

By measuring both the individual mass and the total number of microbes in a given volume of inoculate the LifeScale instrument is able to calculate the total bio-mass content of the sample. This data is a measure of the total mass of microbial material within the sample and is comparable to the data obtained when measuring sample turbidity with conventional optical techniques. The higher the total bio-mass the more turbid the sample. Looking at variations between the mean microbial mass and the total bio-mass yields additional information not previously available with optical techniques. This information includes for example antimicrobial-induced morphology changes and cell lysing.


When concentration is considered at two discrete times, T1 and T2, the data quickly gives information on the viability of a microbe population over that time period. This information can yield resistance/susceptibility. In this example the data suggests that this microbe is susceptible to Cefazolin even at the lowest dose used.


N.B. A time of 30 to 40 minutes from the start of the measurement is typically used for T1. This represents a time when the microbes have ended their lag phase and have entered their growth phase. T2 is usually taken to be the end point of the measurement.