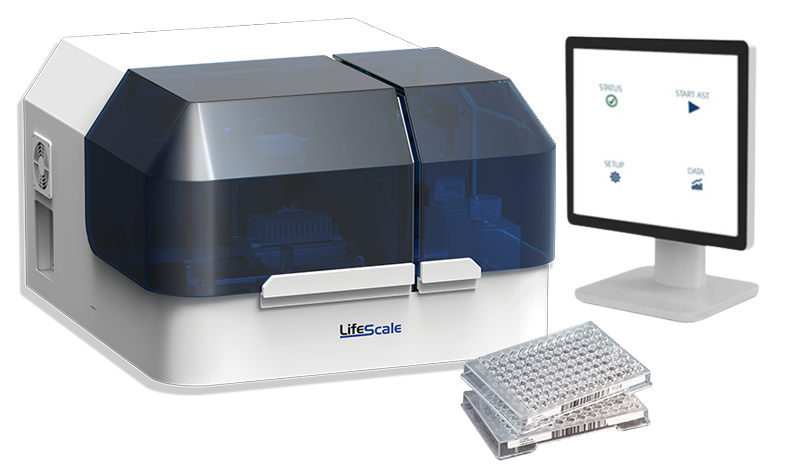
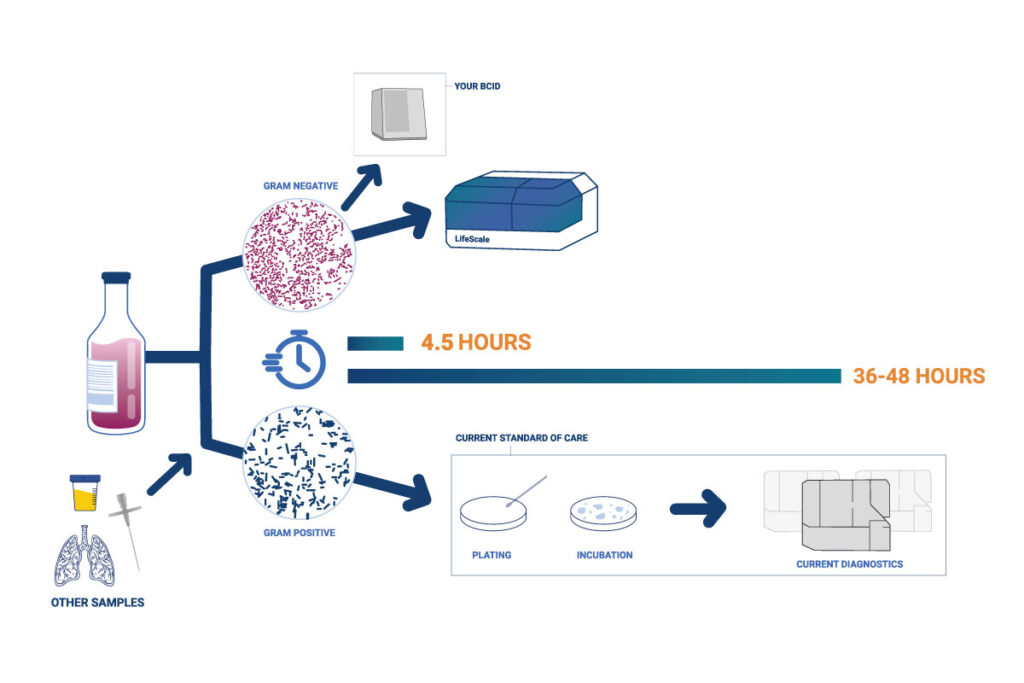
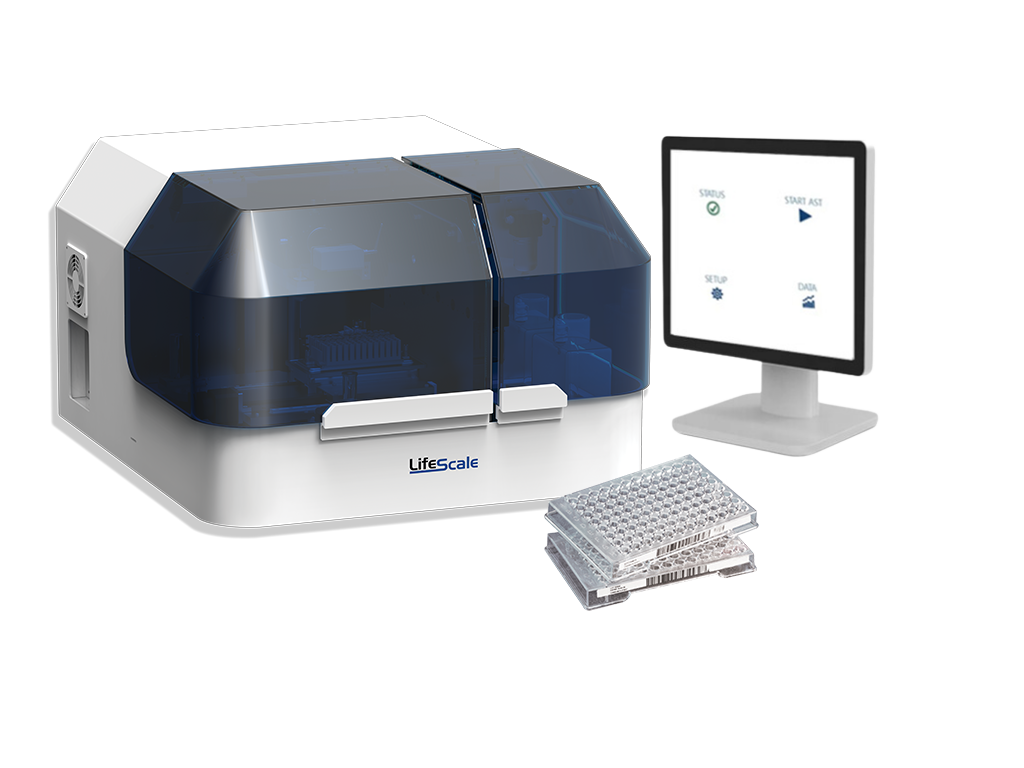
LifeScale provides rapid results when speed matters most to your patients – Gram-negative bacteria in positive blood culture. Its unique population-profiling technology gives results in 4 ½ hours, with the accuracy you demand on the most dangerous resistant strains.
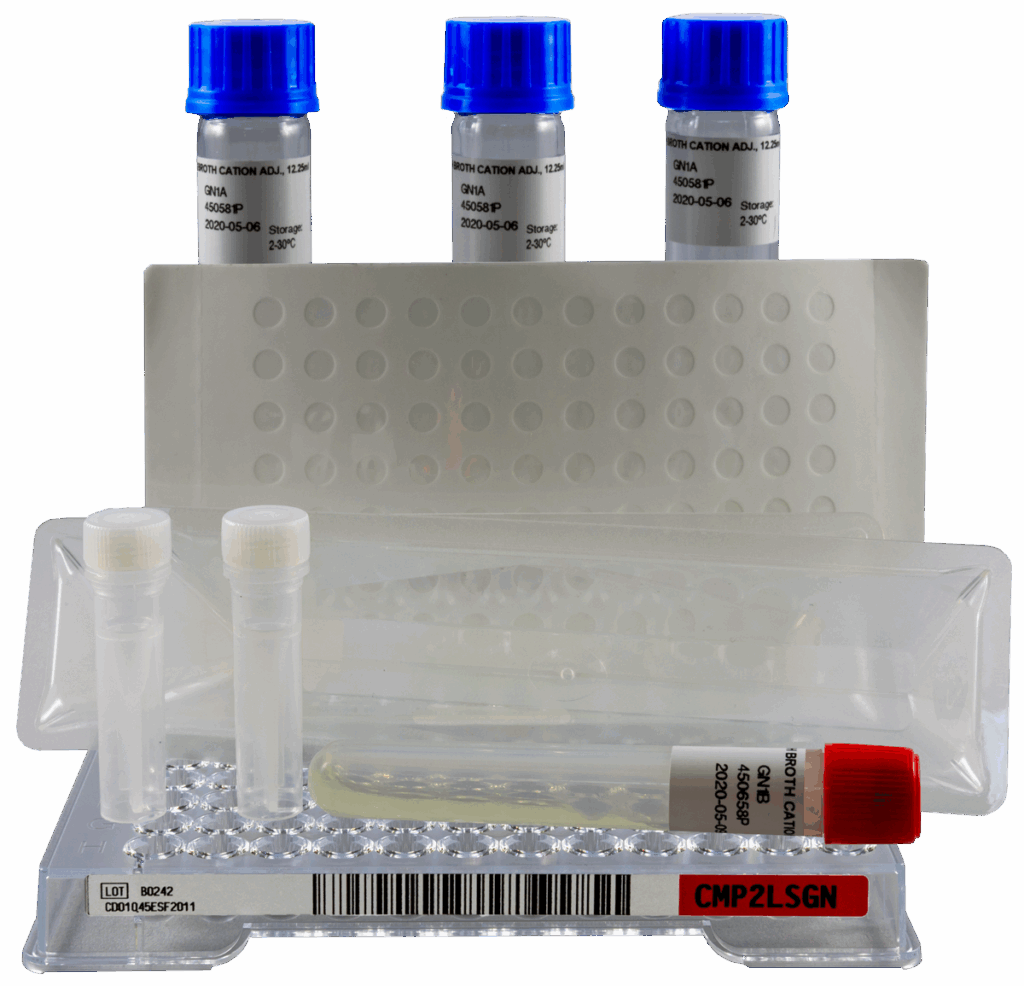
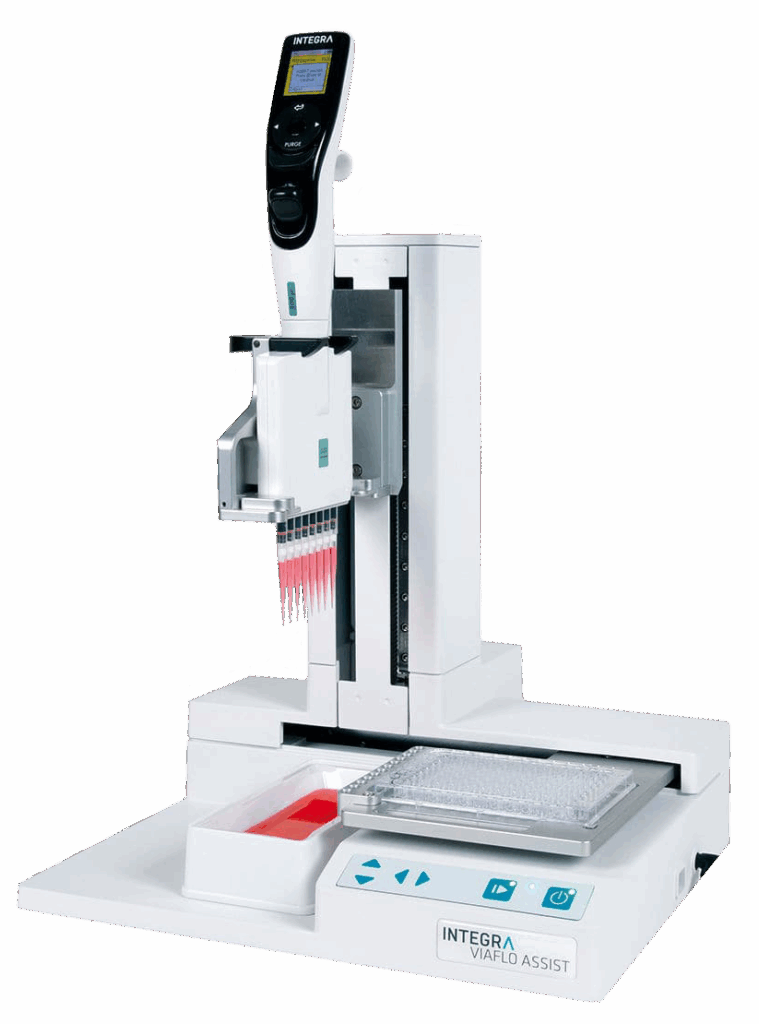
LifeScale’s ease-of-use and reliability are proven in the field, with fast sample preparation, and automated inoculation, incubation, read, and report.


| Genus | Species | Time to Result H:MM |
|---|---|---|
| Escherichia | coli | 4:48 |
| Klebsiella | species | 4:57 |
| Pseudomonas | aeruginosa | 5:11 |
| Acinetobacter | species | 4:50 |
| Average | 4:54 | |
| Average (removing workflow delays) | 4:32 | |
| SOC | Sites | Samples | Organism/Antibiotics | % Resistant | Essential Agreement | Categorical Agreement | Very Major Errors | Major Errors | ||
|---|---|---|---|---|---|---|---|---|---|---|
| Standard of Care | LifeScale AST system | Standard of Care | LifeScale AST system | |||||||
| All | 6 | 651 | 6715 | 22% | 95.4% | 94.8% | 38/425 8.9% | 22/423 5.2% | 40/856 4.7% | 27/864 3.1% |
| Walkaway | 3 | 348 | 3491 | 20% | 97.1% | 94.7% | 14/207 6.8% | 7/205 3.4% | 24/464 5.2% | 16/464 3.5% |
| Phoenix | 2 | 206 | 2306 | 15% | 96.1% | 94.9% | 9/119 7.6% | 10/119 8.4% | 14/325 4.3% | 9/327 2.8% |
| Vitek | 1 | 97 | 918 | 43% | 93.8% | 94.8% | 15/99 15.2% | 5/99 5.1% | 2/67 3.0% | 2/73 2.7% |

Come see us during the SCACM Fall Meeting, Ohio, Oct. 29th, 2025 in Ohio at Quest Conference, Center 9200 Worthington Rd, Westerville OH 43082.

Come see us during the SCACM Fall Meeting, Wisconsin, Oct. 23rd, 2025 in Kentucky at Kentucky Community & Technical College System (KCTCS) 300 North Main Street Versailles, KY 40383.
